


The last Federal Reserve (Fed) interest rate hike occurred on July 26, 2023. The Fed has held interest rates steady ever since, and most economists now agree that future rate cuts are more likely than future rate hikes. If the Fed is truly done raising interest rates, how should we expect stock and bond markets to perform moving forward?
How Did We Get Here?
Headline inflation reached its peak of 9.1% in June 2022. High inflation is not sustainable for an economy in the long run, so the Fed began raising interest rates aggressively, attempting to slow the economy and cool inflation. The Fed went on a historic interest rate hiking campaign, raising rates 11 times from March 2022 to July 2023.
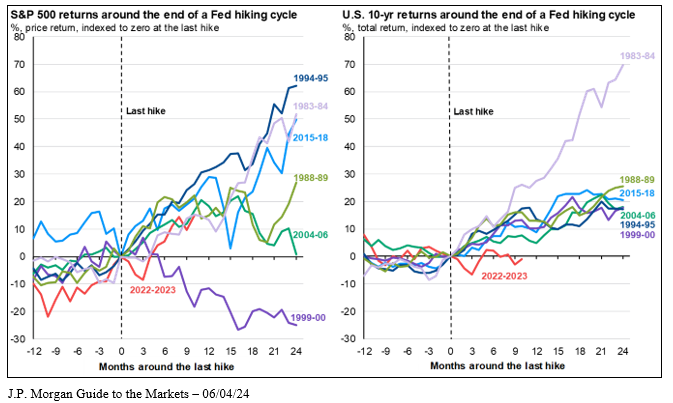
The Fed rate hiking campaign appears to have achieved its purpose, as headline inflation moved from 9.1% in June 2022 to 3.4% in April 2024. Reducing the final pieces of inflation to reach the Fed’s target of 2% remains difficult. Still, many economists predict that we are in a temporary holding period after which the Fed will begin to cut interest rates. Historically, the end of a Fed rate hiking cycle has been a positive sign for markets. The chart below displays the return of the S&P 500 (left) and the U.S. 10-Year Treasury (right) in the 12 months prior to the last Fed rate hike and the 24 months after the last Fed rate hike over the last 7 Fed hiking cycles.
Stock Market
As can be seen on the left side of the chart, over the 24 months following the last rate hike, the S&P 500 experienced positive returns in 5 out of the previous 6 cycles. 4 out of those 6 cycles produced 27%+ returns. The 1999-2000 cycle ended with negative returns, as investors experienced the tech bubble bursting in the early 2000s. Though not guaranteed, this chart shows that the stock market generally experiences positive returns when the Fed ends a rate hiking cycle.
Bond Market
The bond market generally experiences less volatility than the stock market, so the variance in returns of the 10-year U.S. treasury over the last 7 rate hiking cycles was much less than that of the S&P 500. As can be seen on the right side of the chart, over the 24 months following the last rate hike, the 10-year U.S. Treasury experienced 17%+ returns in all 6 of the previous cycles. The results of our current cycle remain to be seen, and returns are never guaranteed, however the bond market appears positioned for positive performance.
Summary
Historically, stock and bond market performance has often been positive following a Fed rate hiking cycle. It is important to note that the chart above only displays the returns of the S&P 500 and the 10-year Treasury following a rate hiking cycle. Based on valuations, certain asset classes may be positioned to perform better than others in a level or falling rate environment. If you are unsure whether or not your portfolio is positioned to take advantage of the current interest rate environment or have other questions about your portfolio, please reach out to our team.