

Every four years, investors’ emotions run high as markets intersect with the U.S. presidential election. At Voisard Asset Management, our priority is clear: Empowering clients with data rather than political or emotional views. We believe that data-driven decisions are the key to successful investing, and we are committed to providing the facts to help our clients make informed, emotionless decisions.
A common question is whether the sitting President directly impacts the market. One popular benchmark for a president’s economic “success” has been the performance of the S&P 500. There have been twenty-four election years since the inception of the S&P 500 index, with only four election years seeing negative returns. Delving deeper into the negatively returning years, it becomes evident that these four years were influenced by significant global events beyond the election, such as the Great Depression, World War II, the Tech Bubble, and the Great Recession. These events had substantial adverse effects on the economy as a whole.
While the president is just one of many market variables, other variables play significant roles, such as interest rates, 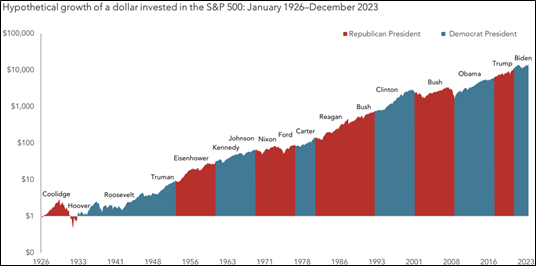 health crises, natural disasters, corporate activity, and technological advancements. While the presidency receives much attention, as it should, it’s crucial to recognize that shareholders are investing in corporations, not merely a political party. As seen in the chart from Dimensional Funds above, historical data shows that regardless of whether the president in office is Democrat or Republican, the S&P 500 tends to yield positive returns over time due to factors such as economic growth, inflation, compounding returns, market efficiency, and innovation. Moreover, the resilience and adaptability of the market in response to various external factors highlight the complexity of what drives market performance beyond mere political leadership.
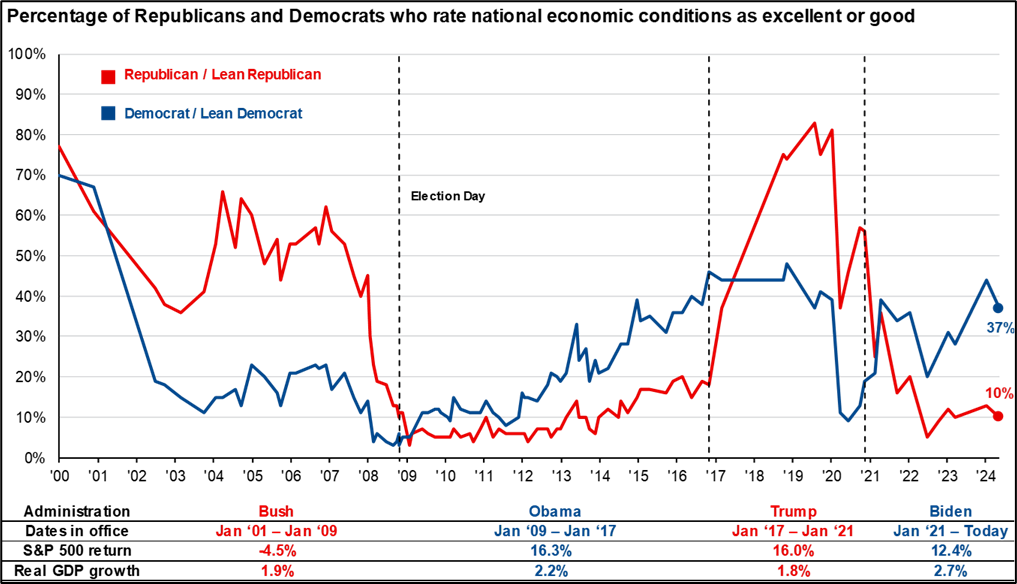
While emotions and political biases heavily influence public perception of the economy, analyzing historical data from the S&P 500 and GDP growth reveals that economic performance is not consistently tied to the party in power. The chart below from JP Morgan Asset Management depicts the relationship between emotions, political parties, and economic data. The Pew Research Center regularly surveys Americans’ economic views by asking, “How would you rate economic conditions in the United States today…as excellent, good, only fair, or poor?” The results are what you would expect: People tend to think the economy is doing better when their political party is in power and worse when it is not. However, when we compare these feelings with the actual numbers on GDP growth or S&P 500 returns during the terms of the past four presidents, we see a different story. We find that political bias often influences personal opinions about the economy, but the fundamental economic indicators tell a more complex and less partisan story. If you had one dollar in 1926 and held onto it as cash, it would be worth approximately $17.75 today. But if you had invested that same dollar in the S&P 500 in 1926, it would be worth roughly $10,000 today. During that time, we have had 17 different presidents, major wars, and various domestic and international events.
At Voisard Asset Management, we understand that people feel strongly about political candidates and their policies, which is important. However, when investing, keeping emotions out of our decision-making process allows us to cut through the noise and focus on the fundamentals that drive the economy and stock market. If you have questions regarding navigating the current political landscape within your portfolio or additional financial topics, our team stands ready to assist.