

About a month ago, we shared that valuations matter. This blog post will look at the valuation of the S&P 500 through the lens of the price-to-earnings ratio (P/E ratio), one of the most widely used valuation measures. As a reminder, the P/E ratio is a way to value a company by comparing its stock price to its earnings. In simple terms, the P/E ratio tells you how much you are paying for each dollar of a company’s earnings. We can then compare the stock’s P/E ratio to historical averages to determine if we are paying more than normal or less than normal for each dollar of earnings, ultimately telling us if the stock is currently cheap or expensive.
At the time of the last blog post, the forward-looking P/E ratio for the S&P 500 was 20.3x. Today, it is slightly higher, hovering around 20.9x as of the close of the market on 6/12/24. Clients often ask us what they should expect to make in the stock market, to which we almost always say, “If I knew that, I’d be a billionaire, and we wouldn’t be talking…unless you were on my private island”. In all seriousness, while we can’t predict the future, we can look at historical returns as a guide for expected future returns.
What Should We Expect?
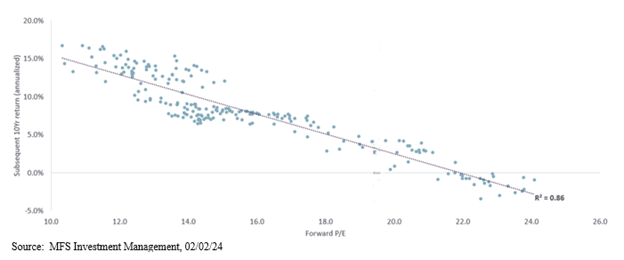
Historically, when investors buy stocks at lower valuation points, their subsequent 10-year returns tend to be higher than when they buy stocks at higher valuation points. The chart below shows the 10-year annualized returns (y-axis) based on starting forward P/E ratios (x-axis) of the S&P 500 for every month since 1992. When P/E ratios reach around 22.0x, annualized returns of the S&P 500 have historically been flat or negative over the next 10 years. If we look at historical returns for the current S&P 500 P/E ratio of 20.9x, annualized returns have been between 0% and 5% over the next 10 years. So, if an investor only held the S&P 500 and asked me today what they should expect to make per year on average over the next 10 years, our best guess would be between 0% and 5%.
What To Do?
As we mentioned recently, market performance remains concentrated, as the largest stocks in the index have continued their dominant run. In both absolute terms and relative to history, value stocks, along with international markets, look attractively priced compared to U.S. growth stocks. Although valuations appear stretched, there are still attractive opportunities beneath the surface, and an active approach can help investors identify those companies with high-quality earnings and attractive valuations. Investors may find it helpful to have a manager on their side willing to sort through the noise and strategically tilt their portfolio toward sectors with attractive valuations. While serving its purpose over the past decade, the simple index approach may not be as dominant as it has been.
Summary
Voisard Asset Management Group is always looking for ways to reduce our clients’ risk by utilizing the specifics of their situation to take advantage of market conditions. Each circumstance is unique and requires an individualized analysis to determine the optimal strategy. As is customary, individuals should consult with their professional advisors to ensure appropriate risk is being taken within their investment portfolios. Ultimately, our objective is to position our clients to give them the best potential to achieve their goals while working to reduce risk along the way.