Market volatility is back. After going nearly 310 trading days since a back-to-back daily decline of 0.5% or more, we witnessed a market decline as measured by the S&P 500 of nearly 10%. While some investors have become nervous, we see this as a reversion back to normal market volatility. It is easy to show a “recency bias” and compare the recent volatility only to what we have seen over the last two years which is virtually no volatility. We have seen better-than-average returns in 2016 and 2017, coupled with low volatility. Looking back at the past 2 years, many investors view the low level of volatility as the “new normal,” however, this is far from the truth.
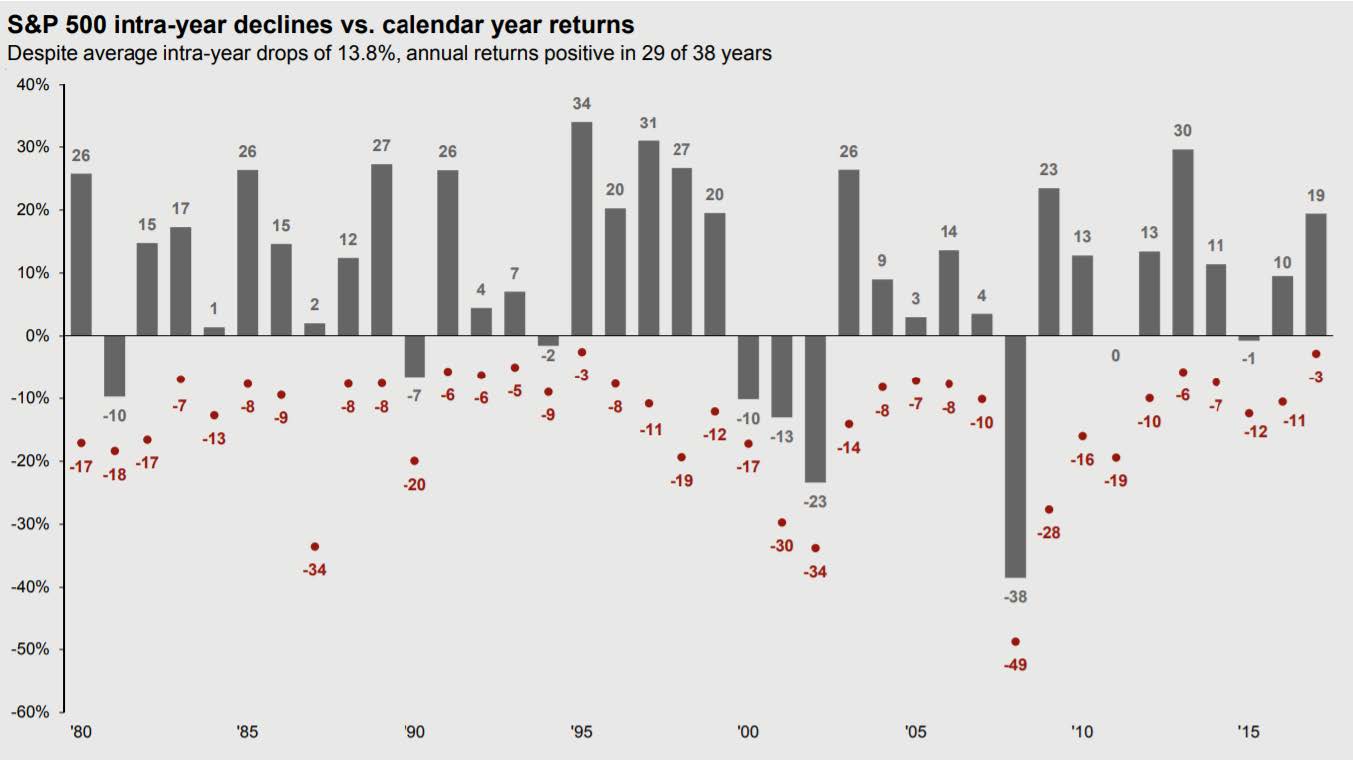
Consider the chart below showing the return of the S&P 500 since 1980. The gray bars outline the actual returns of the S&P 500 (excluding dividends), while the red dots show each intra-year drawdown, which is defined as the largest drop within each year.

Source: JP Morgan, data as of 12/31/2017
As you look across the graph, you will see many years where the market has fallen in the high single digits or low double digits. While there will always be outliers, the average yearly drawdown from 1980 to 2017 was 13.8%. When we compare the drawdown that occurred this month to history, we can see that the drawdown we experienced is normal.
Just because volatility is normal does not mean it is comfortable. We understand that these periods of increased volatility can be stressful for investors, but not overreacting to these circumstances is necessary for achieving desired long-term returns. While it may be uncomfortable to experience a 10% market decline, in reviewing the returns over the last 12 months (including the recent draw down), the S&P 500 has still returned nearly 17%! Backing our time horizon out we see that the S&P 500 has returned 9.2% on an annualized basis over the last 10 years. As shown by the red dots above, the last 10
years have been anything but calm.While we cannot predict future returns, we can predict with confidence that investors will achieve positive returns if they stay invested through periods of increased volatility.
The logical next question is “Where are we going from here”? Market fundamentals remain strong and the economy is still growing. Unemployment has fallen to 4.1%, a 17-year low, and consumer spending remains positive. If we couple a strong economy with a fiscal stimulus such as the recent tax reform legislation, repatriation, and expected infrastructure spending, we see another positive year in 2018. This outlook doesn’t mean that a correction or market drawdown is out of the question, but that the current economic indicators still provide a solid argument for the market continuing to rise through 2018. If we do see a correction or market pullback, don’t focus solely on the correction, but take a step back and look at the big picture. Investing takes patience and discipline during a storm.
Lastly, it is important to make sure the risk in your portfolio is appropriate for your current situation. Your allocation to stocks and bonds will be the biggest determinant of how your portfolio reacts in times of market volatility. As we have said before, the best time to review the risk exposure in your portfolio is not after a correction has occurred, but before the next one happens. By managing your portfolio in strong markets, you can control portfolio swings in times of increased market volatility.


