


Once every four years, politics and finance converge as the American public elects a President and investors try to determine stock market performance during presidential election years. A look back at history shows that presidential election cycles indeed correlate with stock market returns, but these trends may be dissipating. While it is tempting for investors to try to time decisions, you can’t bank on future returns to match past performance.
Looking back at returns of the S&P 500 for each of the 23 election years since 1928, 17 have ended positively with an average annual return of 7.1%. In addition to that, since 1952, the Dow has climbed 10.1% on average during election years when a sitting president has run for re-election. Politicians recognize the relationship between voter approval and the state of the economy. Sitting presidents often aim to boost the economy just prior to a presidential election, thus garnering voter approval for their re-election and incumbent party.
Although the Federal Reserve is responsible for monetary policy (interest rates and money supply) and the President has limited influence on this, the executive branch can influence fiscal policy (changes in taxation and spending patterns). This is one reason you may see a sitting President rolling out new policies or pushing for lower taxes that can bolster the U.S. economy leading up to a presidential election.
There is a modern theory that studies the correlation between stock market performance for the four-year term of a U.S. President. It is called the Presidential Election Cycle Theory. The fundamental assumptions of this theory are as follows:
- In the first half of a presidential term the newly elected president jumps from campaign mode and works toward fulfilling campaign promises. Because of this mindset, the first year is typically the weakest (in terms of economic growth) of the presidential term and the second year is not much stronger than the first.
- This weakness in the economy is because campaign promises in the first half of the term are not typically aimed at strengthening the economy; they are aimed at political interests, such as tax law changes and social welfare issues.
- In their third and fourth years, the President re-enters campaign mode and works toward strengthening the economy. The third year is typically the strongest of the four and the fourth year is the second strongest of the four-year term.
- The second half of the presidency is usually stronger than the first because of economic stimuli, such as tax cuts and job creation.
- These trends are fairly consistent, regardless of the President’s political affiliation or leanings.
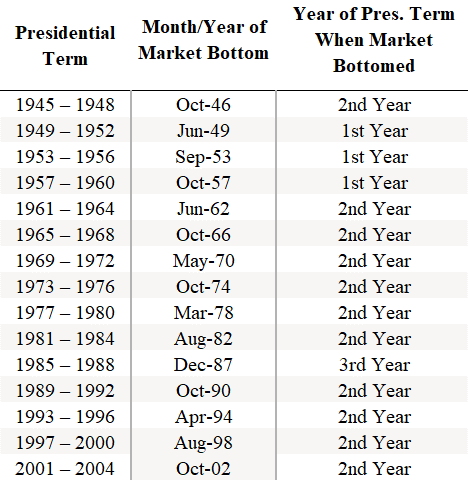
When comparing presidential terms with the economic cycle from 1942 to 2004, there was strong correlation between a market trough and the first or second year of a presidential term. On average, during this time frame, the troughs have occurred 1.87 years into a presidential term as is illustrated with the chart below:
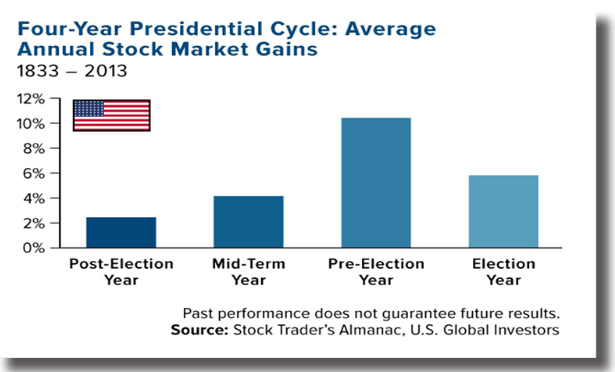
Long-term, there seems to be some validity in the assumptions of the Presidential Election Cycle Theory, as seen in the chart below:
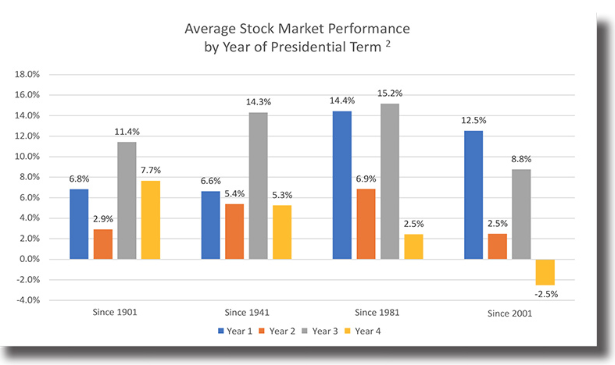
But when looking at more recent years, this pattern dissipates:
![]()
Studying the Presidential Election Cycle Theory is useful, but only if the patterns continue. In recent years, the results have not been in line with these fundamental assumptions. For example, the market performed much stronger during Donald Trump’s first year as President than the second. The first half of Barack Obama’s first term as President was also stronger than his third and fourth year, and the same occurred in Obama’s second term. Similarly, Bill Clinton had strong first years in both of his terms. One must not confuse causation with correlation. While history shows that the third year of a president’s term has been, on average, better for stocks than the first, the fact remains that this is “on average.”
Investors assume better times for economic growth, stock prices, business conditions, and corporate bottom lines in the period prior to a presidential election. However, prudent investors must consider the Presidential Election Cycle as only one of many factors that influence economic and market conditions. Politics play a definitive role in financial markets and legislation passed has a significant impact on corporate earnings, but such strategies are not reliable enough to remove market risk, which exists primarily due to the random and unforeseeable nature of economic and market conditions.
In conclusion, The Presidential Elections Cycle Theory has noticed stock market performance during presidential election years is rather limited sample size which makes it difficult to draw definitive conclusions. This theory has not been realized with more recent presidential terms. This is evidence that it is best to stay the course, resist the urge to make emotional decisions, and invest steadily instead of trying to time the market. We know it is best that you don’t time the markets. It is time in the market that counts the most.