


May’s jobs report left onlookers with mixed emotions. As strong nonfarm payroll additions were a sign of economic strength, slowing wage growth and rising unemployment were potential signs of weakening. A resilient labor market is a factoid continually quoted by Fed policymakers as they determine whether to continue raising interest rates throughout 2023. Will the mixed signals offered by the May jobs report convince Fed policymakers to pause interest rate hikes or encourage them to hike rates further?
Breakdown of Job Signals
Countless data points are utilized to assess the strength of the jobs market. Three jobs-specific data points stood out in the May report. They were nonfarm payroll employment, wage growth, and unemployment. Below you will find a breakdown of these as well as what they may be signaling.
Nonfarm Payroll Employment
Nonfarm payroll employment measures the number of jobs added per month in the U.S. excluding those in farming, private households, proprietors, non-profit employees, and active military. In May, U.S. nonfarm payroll employment increased by 339,000 jobs which was well above the median analyst forecast of 190,000. This stark contrast therefore appears to signal economic strength as it is a sign that companies continue to add employees despite wavering economic conditions.
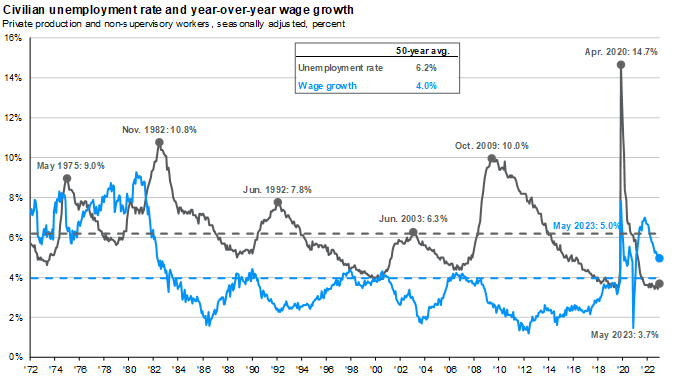 Source: J.P. Morgan Asset Management 6/8/23
Wage Growth
Average hourly wage growth is calculated by dividing the total worker payroll by the sum of total worker hours and one-half of total overtime hours. In May, average hourly wage growth decelerated slightly from a 0.5% increase in April to a 0.3% increase in May. This places annualized hourly wage growth at a 4.3% increase. As displayed by the blue line in the chart above, annualized wage growth of 4.3% remains above the 50-year average of 4.0%. It will be essential for wage growth to continue to cool as long-term elevated wage growth is unaffordable for companies. The Fed will be watching this data point carefully as it continues to make its rate decisions.
Unemployment
The unemployment rate is calculated by dividing the number of unemployed people by the labor force. The labor force is defined as those in the population, age 16 or older, who are employed or who are unemployed and seeking employment. Also, persons who are neither employed nor unemployed are not in the labor force. This category includes retired persons, students, those taking care of children or other family members, and others who are neither working nor seeking work.
In May, the unemployment rate rose 0.3% from 3.4% to 3.7%. A single-month increase is not enough to establish a trend. However, it may be a sign of economic weakening. As displayed by the gray line in the chart above, 3.7% remains well below the 50-year unemployment average of 6.2%. The Fed has stated numerous times that it would like to see an increase in the unemployment rate before it feels comfortable with the status of inflation. The unemployment rate will be a key indicator to track as 2023 marches on.
What it Means for You?
No one person can predict future Fed moves but they can continue to analyze data and make adjustments, when logical. While economic data in 2023 continues to have no clear, concise direction, remaining properly diversified is a key factor in weathering uncertainty. Voisard Asset Management Group makes a concerted effort to track trends, protect assets against pertinent risks, and take advantage of opportunities when presented. If you have any questions about your portfolio, we welcome a simple conversation.